Initial Contact
-
Contact email address. Contact with submitters is through the idr@openmicroscopy.org email list. Email them directly but always cc idr@openmicroscopy.org so that others in the team can follow the correspondence. Ensure you are on the Image Data Resource Submission mailing list. Make sure that any emails that are sent directly to you are forwarded to the mailing list if the list address has not been cc’d.
-
Datasets we have initiated contact with. In some cases one of the team has met someone with an interesting dataset to contribute to IDR and we have already decided that it will be of interest to the general bioimaging community. In these cases you can move to the ‘Obtain the raw images’ step directly.
-
Submitters who have contacted us about submitting data to IDR. In these cases we have to first decide whether we want the data to go into the IDR. We don’t have hard and fast rules about deciding which datasets are ‘reference’ or not and are being guided by EuroBioimaging on the definition (search for ‘reference’ within the Eurobioimaging-Elixir Image Data Strategy document but we aim to publish datasets that have value beyond simply supporting an original publication. Criteria we use (this is on our submission help page) are:
-
Datasets associated with an existing or upcoming publication
-
Complete datasets - not just images supporting one figure in the publication
-
Datasets whose metadata can be integrated with other datasets via identifiers from well-known biomolecular resources (Ensembl, NCBI Entrez Gene, RefSeq, PubChem, ChEBI etc)
-
Datasets generated using new imaging methods or new analysis methods
-
Datasets that are likely to be re-analysed or incorporated into other studies or integrated with other imaging datasets
Use the
Response to initial enquirytemplate to try and find out more. The response can be discussed at the weekly IDR meetings to decide whether we want to include the dataset or not. -
-
Create Redmine issue. Once a submitter has provided enough information for their dataset to be reviewed create a Redmine issue. Use the submitter’s name and optionally a brief summary as the title, and copy the submitter’s answers into the issue description. Assign the issue to Jason for review.
-
Create a name for the dataset. If the dataset is accepted, a name for the dataset is created and used on the Redmine issue and in the directory name for the dataset on all file systems. The name is created from an IDR accession number + first author last name + phrase describing the dataset. It’s not always easy to pick the phrase but if there is a project name e.g. Sysgro or Mitocheck you can use that, otherwise pick out something that is the main focus of the study E.g.
-
idr0001-graml-sysgro- sysgro was the name of the project the data came from -
idr0008-rohn-actinome- this study was looking specifically at genes related to the actinome -
idr0019-sero-nfkappab- this study was looking at NF-κB nuclear translocation
-
If the first author of the publication is not yet known put unknown
instead until it is known. Put idr00XX as the accession number for
now. We used to assign an accession number at this stage but have found
that sometimes the study doesn’t make it to IDR even when we think we
want to have it so better to hold off before assigning.
Obtain raw images and copy to our system
Obtain raw image files from authors
For datasets smaller than 15TB, we have our own FTP service that you can use for the raw data transfer. See the suggested instructions to be sent to submitters.
The FTP server can be accessed via SSH, all data is available under /data/idrftp-incoming/
It is also possible to upload data to the S3 idr-upload bucket.
See the suggested instructions to be sent to submitters.
Assign accession
As soon as the raw data has been uploaded, we assign an accession number to the submission which can be communicated immediately to the authors for inclusion in their upcoming publication or cross-linking from the resources.
The accession number is of form idrNNNN-<first_author_last_name>-<suffix> where NNNN is a 4 digit integer incremented by one for each consecutive accession. A typical email for submitters is:
“For manuscript purposes, your IDR accession is idr0074. To cite your submission in a manuscript, include your IDR accession number and the URL to the IDR homepage. For example, “Data was deposited to the Image Data Resource (https://idr.openmicroscopy.org/) under accession number idr0074.”.”
If an URL is necessary, the top-level gallery URL can be used https://idr.openmicroscopy.org/search/?query=Name:idr0074
Copy raw images plus analysis files to EBI and optionally Dundee
The following process is designed to minimise confusion and reduce the chance of accidentally modifying reference data at EBI.
-
FTP upload data can be found at:
$ ssh idr-ftp.openmicroscopy.org -
In this directory
$ cd /data/idrftp-incoming/ -
Create a study directory here, in the form
idrNNNN-xxxx-xxxxand within this, a new directory for the files uploaded in this batch, named according to the dateYYYYMMDD-ftp. This does not need to be an exact date and you can combine several days together, the aim is to group tranches of uploaded data together. The following steps useidr0085-walsh-mfhrem/20200703-ometiffas an example -
Move the uploaded files/directories into this directory.
-
Run the following script which uses Aspera to sync the study directory to EBI. For example:
sudo ASPERA_SCP_PASS=<PASSWORD> /data/idrftp-aspera.sh /data/idrftp-incoming/idr0085-walsh-mfhrem/If this is a larger dataset this should be done in ascreensession.
Overnight, the data will be linked into place and available on idr-testing and idr-next servers
under /uod/idr/filesets/.
If you need to add other files e.g. from a hard-disk or local copy, you can use rsync to add them
to the ftp server first, then copy to EBI as above.
If this is not feasible, for example due to the size of the data, you can copy the data to a subdirectory of idr0-slot3:/uod/idr/filesets/ and use the /uod/idr/filesets/idrftp-aspera.sh script to copy data to EBI.
For example, to rsync a local file into the ftp server in a suitable location:
$ rsync -rvP --progress image.ome.tiff idr-ftp.openmicroscopy.org:/data/idrftp-incoming/idr0085-walsh-mfhrem/20200703-ometiff/
If you need to copy a file from the ftp server to your current local location:
$ rsync -rvP --progress idr-ftp.openmicroscopy.org:/data/idrftp-incoming/idr0085-walsh-mfhrem/20200703-ometiff/image.ome.tiff .
See the Advanced section below for other data migration workflows.
In the unlikely event that you need direct access to the data at EBI you need an account there.
Create directory for notes files, paper drafts, temporary files etc. Usually, another directory is created to store notes made about a submission, the paper drafts and any other files they might send by email etc. Something like /uod/idr/filesets/idr0038-held-kidneylightsheet/2017-notes-extras
Lock down the UOD data directories to prevent inadvertent changes.
E.g.
cd /uod/idr/filesets/
sudo fileset-freeze.sh idr0038-held-kidneylightsheet (or a subdirectory)
Make the raw data publicly downloadable via Aspera
Making the raw data downloadable is part of the publication process in the IDR. For submissions associated with an upcoming manuscript, journals have started requesting that all deposited data is available when the publication becomes online.
As soon as the raw data have been copied to EBI and an accession has
been given the following steps are possible.
Remember to cc idr@openmicroscopy.org in all emails.
-
Request a FTP user named after the accession number e.g.
idr0038. To do so, email the user creation sponsor. When created, update the Redmine issue by checking the FTP user checkbox -
Email The EBI Aspera contact to associate the study folder under
/nfs/bioimage/dropwith the created FTP user and make it publicly downloadable via Aspera -
Test the data is publicly downloadable using the instructions described in https://idr.openmicroscopy.org/about/download.html
-
If the raw data is made available before the IDR publication, open and deploy a PR against IDR/deployment to make the accession search redirect to the download page - see https://github.com/IDR/deployment/pull/213. This will need to be reverted when the study is published
Archive the data to EBI
Work-in-progress - sent each study to BioImage Archive.
Obtain depositor agreement from authors
A depositor agreement should be sent to the authors. This agreement can be signed using a digital signature (preferred) or print, sign + scan and sent back to us. The signed agreement will
be used for the minting of a data DOI during the publication phase - see Get a DOI.
Advanced
Alternative workflows may be useful for dealing with large or complex data such as HPA datasets.
Warning: the behaviour of openmicroscopy/aspera-client Docker is different from rsync, a directory
20200623-fixes will be copied to <destination>/20200623-fixes
regardless of whether you have a trailing /
If a fileset is present in EBI and Dundee the EBI copy is the reference copy. Any discrepancies should be resolved by overwriting the Dundee copy with the EBI copy.
Get metadata
We are calling a submission of data, linked to a single publication, a study in IDR. Each study might have one or more high content screens (HCS) (== OMERO screen) or “experiments” (== OMERO project). It would also be possible to have a study with a screen and an experiment but we haven’t had a case of that yet.
Figure 2 Example of studies with high content screens and experiments in IDR
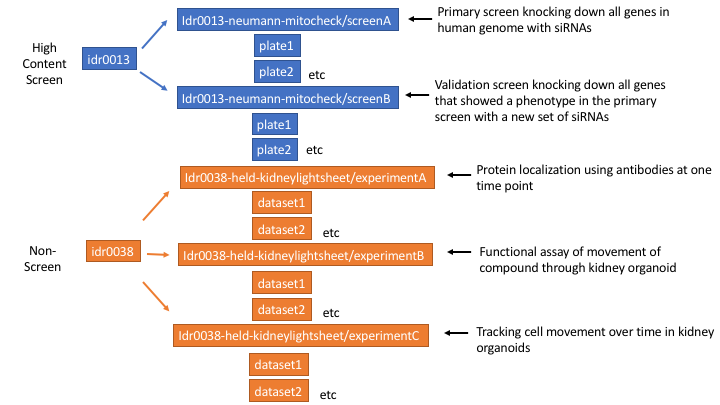
We don’t yet have landing pages for studies so some of the study level metadata just gets repeated for each screen or experiment in IDR e.g. the publication title, study type. (Note: I regret the name ‘experiment’ now as it gets confused with each well in a plate being an ‘experiment’, perhaps project would have been a better name to use).
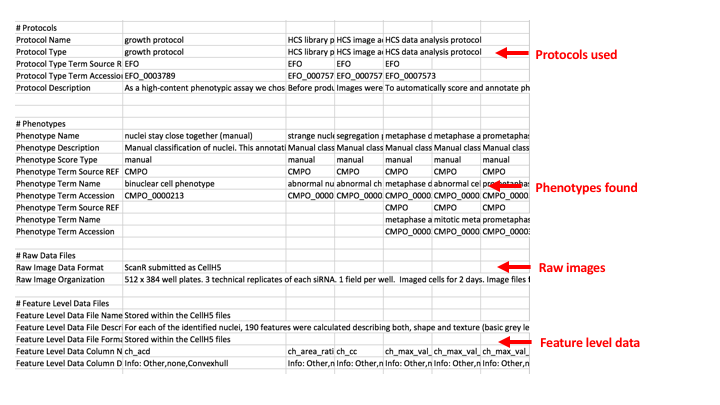
We need to collect information about what the study as a whole is about, about each screen or experiment and what each well or image is about. We collect this metadata in 3 tab-delimited files. These files differ slightly depending on whether is a high content screen or a non-screen dataset (Figure 3).
Figure 3 The three metadata files that are collected about a HCS or non-screen study.
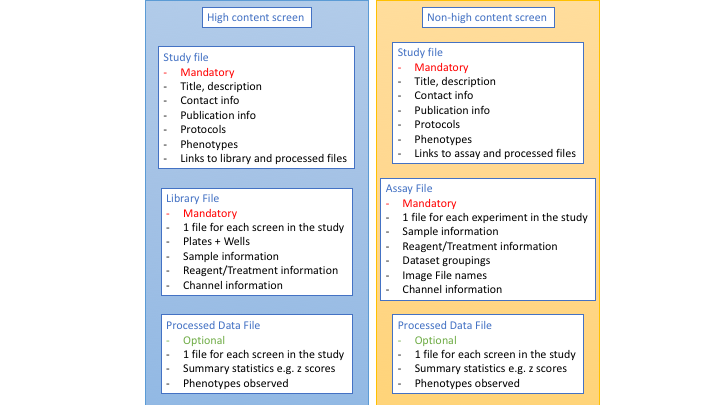
You can see lots of examples of these files in our github repository https://github.com/IDR/idr-metadata.
When authors have contacted us I try to get them to fill out one of our templates. Blank templates can be downloaded here https://github.com/IDR/idr0000-lastname-example/archive/master.zip.
Sometimes authors can’t or won’t fill these out at all, in which case I try to do it and then send to them for checking.
Study, library, assay and processed files in more detail
These files are based loosely on what Gabry developed for HCS in the Cellular Phenotype Database and on MAGE-TAB/ISA-TAB which are used to describe functional genomics and other types of -omics experiments.
The format is still evolving and has some inconsistencies. There could certainly be improvement in the consistency between HCS library files and non-screen assay files. Part of the problem lies in the the fact that the HCS library files can get very big if we include everything that we include in the assay files (e.g. protocols, Experimental Condition columns). This is one of the reasons we also haven’t yet decided to use ISA-TAB as format for all studies.
One of the other issues is that when we add the annotation to IDR each column must have a unique column name. In MAGE-TAB and ISA-TAB there are some columns with the same name that are repeated (e.g. Protocol REF, Term Source REF and Term Source Accession) but we could create a script to make these unique later rather than in the library/assay files as we do now.
Study File
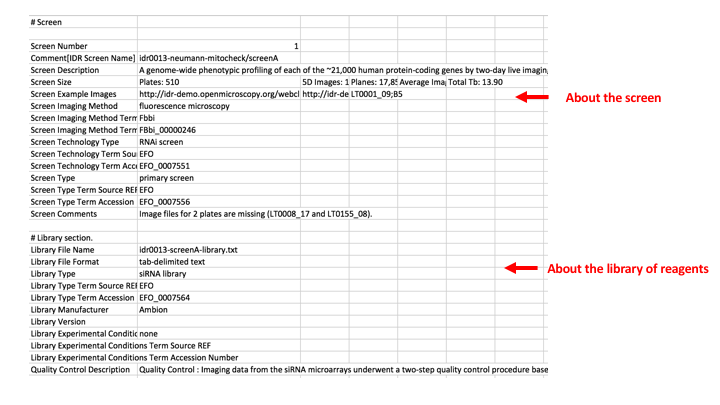
The purpose of the study file is to gather top level information about the study as a whole, and to provide links to the other files such as the library or assay file, the processed data file and note if there are any other additional files such as feature or tracking data. Looking at idr0013-neumann-mitocheck as an example as an example:
The first section contains the:
Study Title - usually the same as the title for the paper
Study Type - for HCS this is always ‘High Content Screen’ for non-screen experiments I tend to try and make something up that sounds appropriate - see this controlled vocabulary gdoc for values used. In hindsight I think most of the non-screen Study Types should be put at the Experiment level. Not sure what I would put at the Study level.
Study Publication - list the publication details here. If there is > 1 publication linked to the images (e.g. re-analysis) then list each in a separate column (see idr0016 as an example of this).
Study Contacts - List contacts in columns. Usually there is a ‘submitter’ but any of the roles under organization role in the Experimental Factor Ontology could be used.
Term Source Name/URI - this lists the acronym and URL for any ontologies that are used in the study, library/assay and processed files.
Study License and Data DOI - not all studies yet have this, but this is the place to include this information if we do have it. (The example is from idr0028). Note in the UK Licence (noun) and Licensing (verb) is used but the USA uses License/Licensing. I started off UK style but am changing to USA style as so many web sites such as Creative Commons use this. There may still be a mixture in the files/IDR.

The next section contains the information about each screen or experiment. The entire next block is repeated for each screen/experiment. The Screen/Experiment Number is incremented in each block.
This is example is from idr0013-neumann-mitocheck/screenA. Experiments are similar but probably simpler as they don’t have any library information.
Screen Description - I often write this if the submitter hasn’t written anything. This will be shown in the right hand screen description panel in IDR.
Screen Size - BioStudies thought it would be useful to have this information. In reality it is a pain to fill in, as some of the information is not obtained until after the screen is in IDR. I would drop this in future.
Screen Example Images - Ask the submitter if there is a particular image they think shows the dataset well. Used on the EuroBioimaging IDR page and in social media announcements about the dataset.
Screen Imaging Method - I have been using terms from the Biological imaging ontology (Fbbi) which covers most terms.
Screen Technology Type - e.g. RNAi screen. See the controlled vocabularly gdoc for terms I have used. New ones can be created.
Screen Type - e.g. primary screen. See the controlled vocabularly gdoc for terms I have used. New ones can be created.
Screen Comments - free text for anything you want to say about the screen that doesn’t fit elsewhere. I put in info about missing images, or about specific things I have added during curation e.g. if i have added Gene Symbols where they were missing.
Library File Name - this is the name of the library file we will create.
Library Type - e.g. siRNA library. See the controlled vocabularly gdoc for terms I have used. New ones can be created.
Library Manufacturer and Version - Enter if known.
Library Experimental Conditions - if is just the reagent (e.g. siRNA or compound) that varies then put nothing here but if there are additional variables such as the conditions the cells were grown under then enter the name of the variable here. In Experiments rather than Screens there is usually at least one Experimental Condition.
Protocols - the protocol text is listed in the study file. Usually this is just copied and pasted from the paper so its value is limited. (This section comes from MAGE-TAB/ISA-TAB where there is no expectation that every study has an associated publication). For Experiments the name of the protocol is later referenced in the assay file. There might be two different treatment protocols (e.g. treatment1 and treatment2) and the NAME of the protocol can be listed in the assay file on the rows for the samples that were treated according to that protocol.
Phenotypes - this section lists all the phenotypes that the authors identified and their mapping to ontology terms. Usually the Cellular Microscopy Phenotype Ontology is used. If a term does not exist I request it via the github issues for CMPO. They have just moved to using this ticketing system and I haven’t used it yet. They used to use the EBI Jira Ticketing system. You can see my past tickets here. The actual phenotypes are reported in the library or assay file but this file can be many lines long. So it’s easier to show the mappings to ontology terms here and then later we combine everything from the library, processed file and these mappings in the annotations file we put into IDR.
Raw Files - a brief description of the type of raw files (from Bioformats list of file types if possible) and the organization of the raw files.
Feature level data - here I put information about feature level data files, including the column headings and what the data in each column represents. This is very time consuming to do however, so unless this information is provided by the submitters I don’t think time should be spent on it every time.
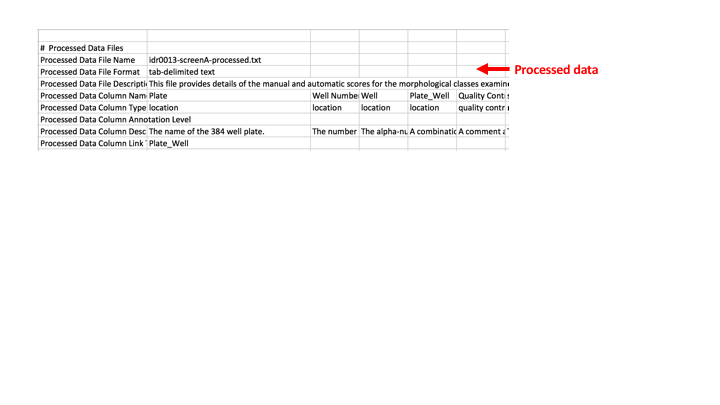
Processed data - this section describes the processed data file, if there is one. It gives a general description of what is in the file. Then lists each of the column headings, and then underneath them says at what level the value is for e.g. is the phenotype derived from the images in just one well, or from the images from several replicates of an siRNA spread over several wells? Or even from several siRNAs all targeting the same gene. This row is an attempt to show how the values in the processed file were derived as sometimes values in different columns are derived from different sets of images. The final row is ‘Processed Data Column Link To Library File’ or ‘Processed Data Column Link To Assay File’. There needs to be some column in common between the processed data file and the library or assay file so that we can combine all the data into one file for importing into Omero. This can be something like a combination of ‘Plate_Well’ or something like ‘Gene Identifier’. The column in common should be listed here.
Library or Assay File
The purpose of the library file is to list all the plates in the screen and what has been imaged in each well e.g. the cells and any treatments done to them, or the time point the image was taken at. A simplified version would be (from idr0013-screenA)
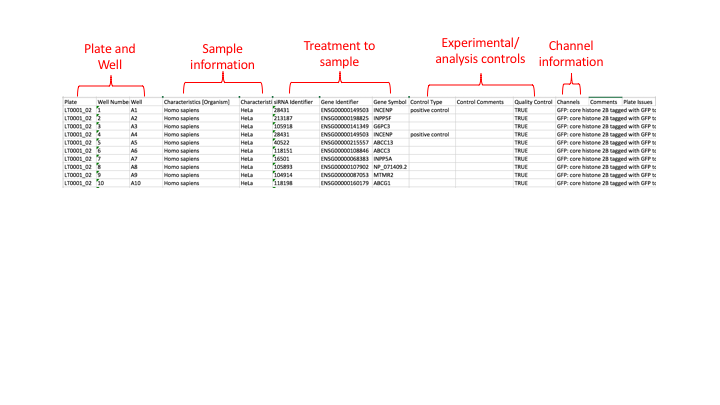
Each row in the file gives information about one well on a plate.
The assay file is similar in that it lists all the images in a experiment and gives information about that image e.g. the cells and any treatments done to them, or the time point the image was taken at.
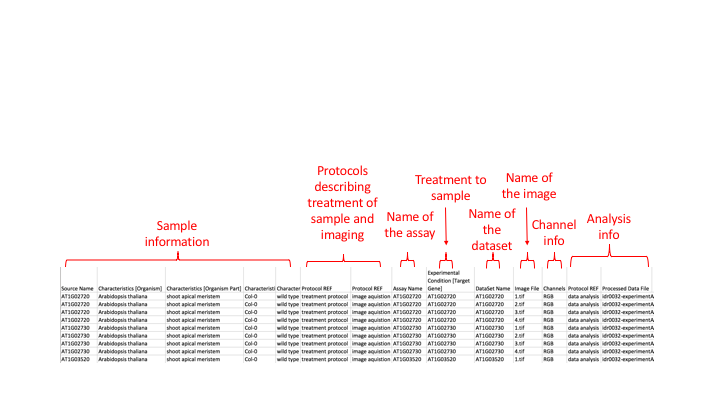
Each row in the files gives information about the sample, treatment, channels etc associated with one image.
There are similarities between both library and assay files; both give information about the samples (i.e. cells), the treatments done to those samples and things like the channel information. The assay files are much more like the MAGE-TAB and ISA-TAB methods of describing assays. The library files are like a cut down version of this to avoid repeating some information on every row (e.g. we don’t list the source name and protocols on every line) since the files can be very big (> 190,000 lines in the case of idr0013-screenA) even without doing this.
Library files in more detail
For library files we start at the point of plates and wells. We don’t worry about fields. Most submitters are able to provide a file with at least plates as sheets in Excel files and then a list of wells.
For well number I always convert to A1, A2, A3 etc because this is how it was in the first screens I did but I suspect its ok to keep them as A01, A02, A03 etc if that is how they are in the files you receive.
A ‘well number’ is usually added for nice sorting by Plate then Well Number rather than Plate then Well (e.g. A1, A2, A3) because Excel will sort it to be A1, A10, A2 etc). I add the well number using a lookup from some Excel files I have created (384WellPlateNumbersAndLocations.xlsx, 48WellPlateNumbersAndLocations.xlsx, 96WellPlateNumbersAndLocations.xlsx
- these are in github under idr-metadata/misc_extra.
I used to make sure every well on a plate was accounted for in the library file and add annotations for wells that are missing from the list the authors provide (e.g. empty wells, or sometimes wells that are rejected because the images were out of focus) using a script called identify_missing_wells_and_add_as_empty.pl but this takes a lot of time and I later decided it wasn’t worth the effort as generally IDR users are not going to be interested in these wells and their annotations.
Then we start to describe the sample that is in each well with a series of Characteristics [attribute] columns. E.g. Characteristics [Organism], Characteristics [Cell Line]. The main attributes I have used so far are:
| Attribute | Example |
|---|---|
| Organism | Homo sapiens |
| Cell Line | HeLa |
| Strain | C57BL/6J |
| Organism Part | brain |
| Developmental Stage | Adult, or embryonic day 13 |
| Age | 4 weeks |
| Genotype | Baz1a knockout |
| Individual | Mouse53 (if for example brain and liver samples are taken from the same mouse it is useful to say it is the same mouse) |
| Clinical Information | OVA expressing tumor (this is a very general category for anything that is about a disease) |
| Replicate | 1, 2, 3 etc (useful if they have labeled their samples with biological replicate numbers) |
Others that might be useful could be Disease, Disease Stage, Clinical Treatment. I try to take attribute type names from the Experimental Factor Ontology (EFO) but a new attribute term could also be made up if needed.
Then we add columns to say which ontology term these attribute values (e.g. brain, eye, kidney) could be mapped to; “Term Source REF” and “Term Source Accession” columns.

Look for the term in the Ontology lookup service which lists lots of different ontologies about lots of different biology/chemistry fields. If given a choice I tend to use terms that are in EFO because I am familiar with it. Usually I try to actually use the ontology term itself for consistency but it could be the case that the author has used a very specific term and I would keep that and just map to the closest ontology term. E.g.
| Author has used | I use as the attribute value | Ontology term this is mapped to |
|---|---|---|
| “Hela cells” | HeLa | HeLa (http://www.ebi.ac.uk/efo/EFO_0001185) |
| “Upper third of left ventricle” | Upper third of left ventricle | heart left ventricle http://purl.obolibrary.org/obo/UBERON_0002084 |
Sometimes there is no suitable ontology term to map to. In which case just leave the “Term Source REF” and “Term Source Accession” columns empty. For later import into IDR each column name in the library file has to be unique so we increment the number after Term Source REF and Term Source Accession by 1 each time we add these columns. (It might have been better to add this incrementing when creating the annotation file that is imported into IDR instead of having it in the library and assay files).
Why do we bother mapping to ontology terms? There are 2 reasons - one for consistency - if we say we always using the EFO term for the cell line HeLa then it keeps the mapr category of cell line tidier and there are not lots of versions of the same thing. Secondly at some point we will probably use the ontology terms in querying. E.g. you might want to query for images from breast cancer cell lines. The ontology has already classified the cell lines into categories like this so we could use the ontology to select all the images where the sample has been annotated with an EFO term that is classified as a breast cancer cell line.
Next are the treatments to the cells. In library files there are a core set of treatments that we just call by their bare names e.g. siRNA Identifier, siRNA Pool Identifier, Gene Identifier, Compound Name. If this file was in true MAGE-TAB/ISA-TAB style they would be Experimental Conditions. Experimental Conditions are the important things that vary between the samples in that study. e.g. Experimental Condition [siRNA] or Experimental Condition [Compound] and this is a clear area of inconsistency between HCS and non-screen annotation files. It comes about partly because we started with screens only.
There are other bits of information that are like supplementary information to the main things that vary. E.g the siRNA sequences, which gene they are targeting, more information about compounds. These can be added as additional columns. E.g. in idr0013-screenA.

Try to keep the value types in each column the same e.g. in the siRNA Identifier column don’t have things like “empty well”, remove these and just stick to the identifiers because otherwise these other values will come up in the mapr query list for that Attribute type e.g. http://idr.openmicroscopy.org/mapr/sirna/.
Also, try to just have one value in each of the columns that become mapr Attribute types (Organism, Gene, siRNA, Cell Line, Antibody, Compound, ORF) otherwise when people search via mapr they will see these concatenated values. The exception to this is siRNA Identifier because siRNAs are often applied to cells in pools where there is more than one siRNA designed to knockdown the expression of mRNA from a gene. In this case you can have the values listed separated by semi-colons e.g.
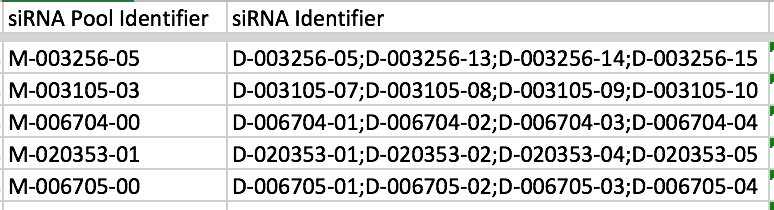
We later split these values when we import into IDR.
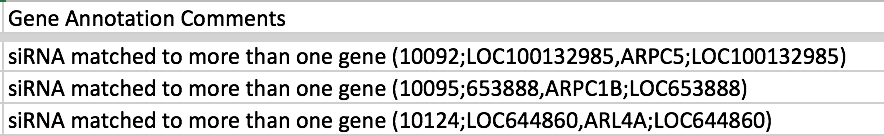
The most common case of where you have more than one value but want to list them all in the column is for Gene Identifier when an siRNA maps to more than one gene. Usually the images for such siRNAs are discarded so we DON’T want to list all the genes in this case, i.e. it’s not a reliable result for any one of the listed genes. So instead of separating the values by semi-colon, it better to move these values to the Gene Annotation Comments column e.g. in idr0012-screenA
In idr0013-screenA, didn’t have a list of all the genes the siRNA matched so just put a comment
There is a balance to be struck between keeping the submitters original column names for similar things and standardizing them, so I tend to have a look at what I did last time and try and be consistent without losing any useful info in the column titles.
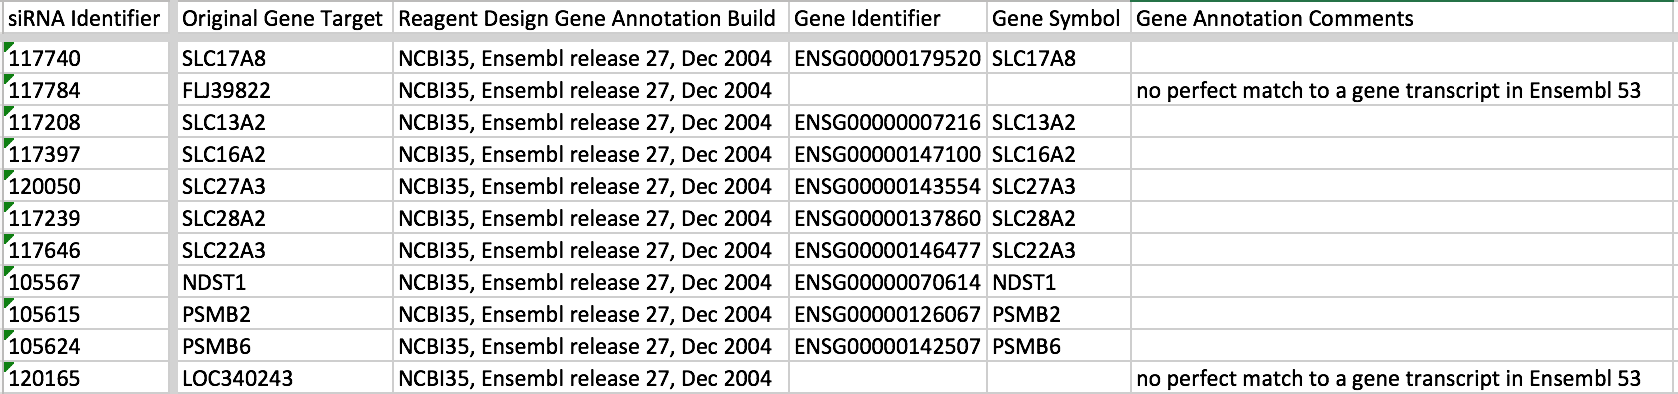
Reagent Design Gene Annotation Build, and Analysis Gene Annotation Build. These two columns are found in siRNA screen library files. I always include them even if they are empty, to show whether these values are known or not. The Reagent design gene annotation build refers to the gene annotation build used to design the siRNAs themselves. The Analysis Gene Annotation build refers to the gene annotation build they used now, i.e. what they have remapped the siRNA sequences to currently. We have only managed to capture this information in a few screens but it is very useful to have for reproducibility. Really we would like to know both the build of the reference sequence AND the gene annotation build (i.e. the release of gene information against that reference sequence). E.g. in idr0013-screenA we have

Ifyou (as a curator) add some missing information then note it somewhere e.g. if a few Gene Symbols are missing then you might add them as IDR users probably search by these but add a note in the Gene Annotation Comments e.g. idr0009-screenA

Examples of “treatment” columns other than siRNA identifiers and Genes
idr0016-screenA - chemical compounds

Always have a Compound Name column and a Dose column if you can. Spell out the unit e.g. micromolar in full. Include the InChiKey if you can.
There might be more than one “treatment” e.g. idr0025 the cells were treated with an siRNA and were staining using an antibody against a protein. The gene related to the localized protein was also included in the library file.

If the treatments are outside of what can be considered a ‘library’ of reagents then they are usually put in the column heading of Experimental Condition [attribute]
E.g. in idr0003-screenA there is Experimental Condition [Environmental Stress] and in idr0019-screenA there is Experimental Condition [Cell Line,] Experimental Condition [Media], Experimental Condition [Compound], Experimental Condition [Dose] and Experimental Condition [Time] (no “library” of reagents was tested at all, just a combination of different conditions).
If I was doing the library files again, I would make all the screens with “libraries” of reagents also with Experimental Condition [attribute] e.g. Experimental Condition [siRNA] and all the other bits of information that come with them as Comment [heading] e.g. Comment [Forward Sequence] or Comment [Gene Identifier].
If the submitters have given a sentence describing the sample e.g. in idr0038 “Wt1tm1Nhsn strain embryonic (E13.5) kidney cells, endpoint staining, not cleared, immunofluorescence, fixed, organoid, six day culture” then I try to separate out all the different bits of information into separate characteristics columns but in some cases I have kept their original description in a column called “Comment [Sample Description]” in case I have missed or miss interpreted something.
Controls
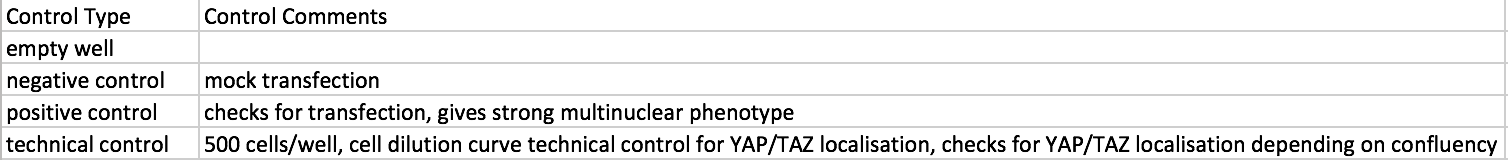
Next in the screen files usually come the columns describing what the control treatments, or untreated wells. There are two columns Control Type and Control Comments. The values in Control Type should come from the controlled vocabulary list. The 2 most commonly used are positive controls (expect to see an effect) and negative controls (expect to see no effect compared to untreated cells). I often find the positive controls out from reading the papers e.g. siRNAs targeting XX were used as positive controls (where you expect to find an effect on the cells). With siRNA screens there is usually a negative control which is a random sequence of siRNA that you don’t expect to do anything to the cells. This makes sure that you are not getting weird effects on cells just by the process of adding the siRNA itself. This siRNA is often called a ‘scrambled’ siRNA.
In screens of compounds, the negative control is usually a compound called DMSO which is a solvent used to dissolve the other compounds in to get them at the right concentration for testing. The DMSO should have no effect on the cells.
The Control Comments list can give more information about the controls. E.g. in idr0028-screenB we have:
Quality Control
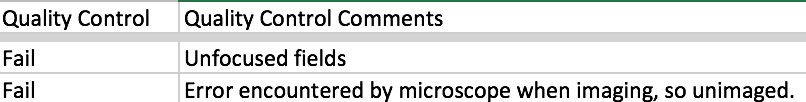
In some screens information is also given about any wells rejected after some quality control checks have been done. Sometimes this is just a pass/fail value e.g. in idr0013-screenA they have put TRUE or FALSE, sometimes there is more information e.g. in idr0028-screenB
You can put a more detailed description of what was done for quality control in the study file. There is a ‘Quality Control Description’ field in the library description section. See idr0013 for an example.
Channels
For each screen I try to give information about what is stained/labeled in each channel. The format is channel name:description;channel name:description;channel name:description etc. I try to tie up the Channel names to the values that will appear in the images. E.g. AlexaFluor647:YAP/TAZ; AlexaFluor568:alphaTubulin;Phalloidin488: F-actin;Hoechst: nuclei.
So format is pairs of channelNameInImage:what is labeled, and separate these pairs by semi colons. The channel name in the image maybe what it is on import, but it might also be set by us in a renderdef.yml file.
Comments
Any additional comments can go here. I have put things like - “annotation not available” if I have no information about the well here, or “missing image” or “fields missing” if I know them.
Plate Issues
If we know there should be a plate of images and we have annotations but no plates, I have included them in the library file but put ‘images missing’ in the Plate Issues column. Its not very common to have this situation now. It was more the case with older datasets.
Summary of what to check in library file
So in summary, if you get a library file in from a submitter I would particularly check
-
All column headings are consistent in format to those in other studies
-
All columns that contain mapr category entries (gene symbol, gene identifier, siRNA Pool Identifier, siRNA identifer, Organism, Cell Line, ORF, Compound) ONLY contain values that belong in that column. Otherwise you will get things like ‘empty well’ appearing in the cell line list in mapr etc.
-
Check that Gene Symbols have not been converted to dates by Excel (sort by gene symbol, check ones like MAR1, SEPT7, DEC1
-
Check that all control wells are labeled as such
Processed Data File
The processed file contains summary level analysis results and phenotypes. It does not contain the actual feature level measurements for each well or image, but its meant to more contain results that are derived from feature level or tracking data.
There isn’t always data that the authors can easily provide at this level.
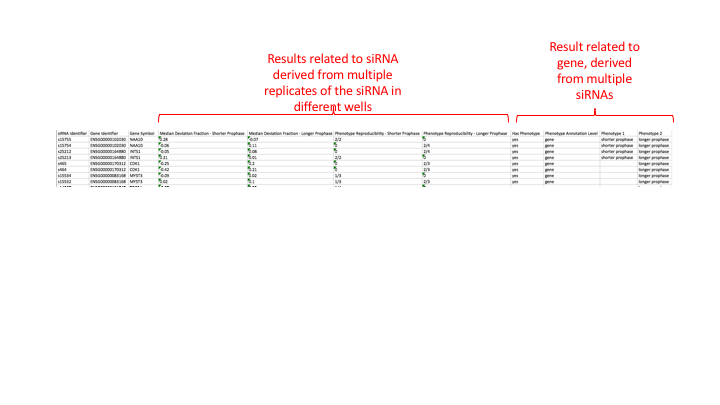
Sometimes the file will contain information that related to different levels of annotation of the images. E.g. there might be statistics relating to each particular well, then relating to several replicates of an siRNA if the same siRNA has been used to treat cells in several different wells, and then there might be information at the gene level (e.g. taking the results of >1 siRNA each targeting the same gene).
Examples
idr0002-screenA
In this example each siRNA was used to treat cells in 4 different wells. But some wells are rejected by their quality control mesaures e.g. too few cells, or images out of focus.
In the processed file they have first given statistics that they have measured over the 4 replicate wells for each siRNA e.g. “Median Deviation Fraction - Shorter Prophase” and then again for each siRNA they say how many replicates are above a certain cut off for this Median Deviation Fraction score e.g. 2/2 or 2/4. There are results for 2 siRNAs targetting each gene. Then they have assigned phenotypes at the GENE level. If half of more of the siRNA replicates that passed QC had a score above the cut off then they get assigned a “longer prophase” or “shorter prophase’ phenotype. This is how a gene can end up with both a longer and shorter prophase phenotype.
To try and show these different levels of results we try to record what the result in each column of the processed file relates to in the study file in the ‘processed data file’ section. This bit is hard work to understand and fill in and we might want to not bother with this in the future. I think it is still useful to record what object (siRNA, gene, compound etc) the phenotype is annotated at though.
idr0002-screenA-processed.txt
(see https://github.com/IDR/idr0002-heriche-condensation/blob/master/screenA/idr0002-screenA-processed.txt) to see this better).
Idr0002-study.txt
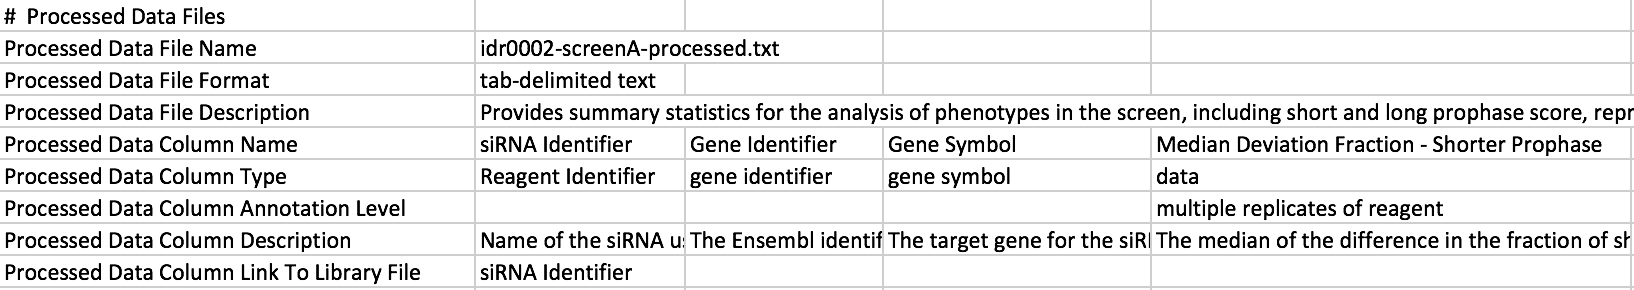
Here you can see that each of the columns in the processed file have been listed in the study file. There is a description of what the data in each column is, and a “Processed Data Annotation Level” for each of the columns containing data. I try to use values from the controlled vocabulary gdoc for the Column Type and Column Annotation Level.
There also needs to be some column in common between the library file and the processed data file so that we can use that column to link the library file and processed file to create the annotation file which has everything. You might have to insert a “Plate_Well” column which will be a combination of the plate and well values, into both the library and the processed data files. (Can use Excel’s =concatenate(A1,”_”,B1) function to do this.
This is only for HCS datasets, in non-screens we create the annotation file by hand but its still useful to have a column in common.
In cases where the same columns appear in both the library file and processed data file, the one from the processed file will be dropped so you don’t get repeated columns in the annotation.csv file when it is created by combining the two files. For this to work the column headings in the two files need to be exactly the same.
Summary of what to check in processed file
So in summary, if you get a processed file in from a submitter I would particularly check
-
All column headings are consistent in format to those in other studies and if there are columns in common between the library and processed file check they have the exact same column headings.
-
Phenotypes are each in their own column, i.e. one phenotype per column. The phenotype name should exactly match what the phenotype name is in the study file (check no trailing spaces).
-
Check that all the column headings in the
Creating the annotation files that are actually used to annotate the data in IDR
Now we have the study, library/assay and processed files (if there is one) we need to be able to get the annotations from these files and into the IDR and linked to the right images.
There are three steps to this process:
-
Create a single file combining the library/assay + processed data
- ontology mappings to CMPO and attach this at the screen or project level as an omero table. This file is a comma separated file called idr00nn-screenA-annotation.csv or idr00nn-experimentA-annotation.csv
-
Create a yaml file that specifies which of the columns out of the annotation.csv/omero table we want to convert to map annotations and which mapr categories they will go into.
-
Create files that will be used by shell scripts to add the annotation.csv and create the map annotations. These files are called prodNN_idr00XX_input_bulk.txt and prodNN_idr00XX_input.txt where NN is the IDR release number and XX is the IDR accession number.
Annotation file
This is created differently for HCS and non-screens.
Screens
If there is no processed data then the library file is just saved as a comma separated file and renamed as idr00nn-screenX-annotation.csv.
If there is processed data then the library file + processed data file + phenotype -> CMPO mappings from the study file are combined using a perl script called create_bulk_annotations_file_using_studyfile.pl. This script is long winded and should be replaced by something better but it does work.
Create_bulk_annotations_file_using_studyfile.pl -s idr0002-study.txt -l idr0002-screenA-library.txt -p idr0002-screenA-processed.txt -n 1
-s => name of study file
-l => name of library file
-p => name of processed data file
-n => the number of the screen in the study file e.g. 1, 2, 3 etc.
It needs to know the screen number so that it can look up the right phenotype-to-CMPO mappings in the study file. The screen number could really be worked out from the name of the library file (i.e. if screenA is in the library file then it would be screen number 1) but I never added this functionality.
If there is no phenotypes listed in the study file and processed file then there will be a warning about this but it doesn’t cause a problem.
Note if you are checking the output in Excel, copy the file to have a .txt extension so that when you open in Excel it lets you choose how the columns should be interpreted. It won’t do this with a .csv file. This means it will change things like “1/4” to the date 01-Apr. And some Gene Symbols will be changed to dates e.g. SEPT1 will be changed to Sept-01. If the file has the .txt extension then you can say to Excel that you want all columns to be “text” format and it won’t do these changes.
Experiments
For non-screen datasets the annotation.csv needs to be created by hand starting from the assay file. Then:
-
Delete Source Name column
-
Delete Assay Name column
-
Delete all protocol REF columns
-
Delete Processed Data File column if it exists
-
Move Dataset Name column to be first
-
Move Image File to be next column after Dataset Name and rename as Image Name (Don’t ask me why I thought this renaming was a good idea!)
-
Add any values and phenotypes from the processed data file.
-
If there are phenotype add columns for their mapping to ontologies (e.g. see idr0018)
Checking the .txt and .csv files
We don’t really do validation of the study, library/assay, processed and annotation files yet but I do run a few checks on them.
IDR/idr-metadata/scripts/check_tab_columns.pl - checks that each row has the same number of columns and for trailing spaces at the end of column values. It will remove the trailing spaces if you select that option. Use -h to see the options. I started doing this as we found some cases where Gene Symbols had been submitted with trailing spaces and mapr counts them as different to Gene Symbols without the trailing space.
IDR/idr-metadata/scripts/check_csv_columns.pl - does the same thing for the annotation.csv file but will not fix trailing spaces as these should be fixed in the files used to create the annotation.csv.
IDR/idr-metadata/scripts/check_utf8.py - checks whether a file contains valid UTF-8. Often the study file doesn’t with characters like degrees (º), pi (π), mu (µ) and beta (ß) in the protocols causing problems. The following is not the best way to do it, but they are usually just replaced with the closest “normal” character or word (o, pi, u and beta etc.) or remove them if it’s just something that has come out strangely.
Bulkmap config file
To create this file we need to go through every column in the
annotation.csv and decide which ones should go into map annotations.
Generally we want values in the map annotations that are searchable so
we don’t include results values such as z-scores etc.
There is both a name and clientname e.g.
- name: Characteristics [Strain]
  clientname: Strain
  include: yes
The name is the name of the column in the annotation.csv file.
The clientname is the name you want it to have in the IDR map
annotations.
Some columns are put into particular mapr groups such as organism,
gene, siRNA. These ones are listed under particular mapr groups
e.g.
- group:
    namespace: openmicroscopy.org/mapr/organism
All the others are just listed but not under a mapr group (usually we list them first) and they appear in the ‘Others’ group in the Attributes section in the IDR.
Look at previous bulkmap config files to see what the client names should be.
If you want to add an external link for the value in another database add an extra line
- name: Gene Identifier
  clientname: Gene Identifier URL
  clientvalue: http://www.ncbi.nlm.nih.gov/gene/
  include: yes
Note that if you put a different URL for the same thing e.g. the same gene identifier, in two different studies you’ll end up with two different map annotations so you need to be careful about what has been used previously by checking through other bulkmap-config files.
Prepare a study repository
Metadata for individual studies are maintained as standalone study Git repositories. These repositories are first created as private repositories on the IDR GitHub organization, so that work happens on a study while keeping it private.
Start by creating the repository at https://github.com/organizations/IDR/repositories/new, ensuring that it is private and the owner is IDR.
Once published, the GitHub repository is made visible. The study repository should also be integrated into the top-level IDR metadata repository as a submodule.
The study repository should contain the following elements:
-
README.md (optional)
-
bulk.yml: (optional, consider addition only in cases of multi-screen/experiments studies) a top-level bulk file containing the common options for bulk import. If creating a top-level bulk.yml, the corresponding per-experiment bulk files must match the syntax, see idr0065-experimentA-bulk.yml example. TODO: Create a bulk.yml inside the idr0000 and point this document to it.
-
idrxxx-study.txt: (not optional, but is typically added only later, not during creation of repo) the top-level study file for HCS studies (in case you have HCS study)
-
idrxxx-study.txt: (not optional, but is typically added only later, not during creation of repo) the top-level study file for non-HCS studies (in case you have non-HCS study)
-
scripts/ (optional): a folder containing various scripts used for the study repository (file generation, processing) TODO: Create a scripts dir inside the idr0000 and point this document to it.
-
experimentA-Z or screenA-Z: these folders contain all the data related to a particular screen/experiment TODO: Make sure that all the appropriate files are inside the experiment and screen dirs of the idr0000.
As the screens or projects are usually quite large we use the bulk import facility to import the images. To do this we need two files:
-
A tab-delimited file listing either
-
A yaml config file saying what the layout of the tab-delimited file is
One way is to create a filePaths.tsv file from what is in the assay file,
using the “DataSet Name” and “Comment [Image File Path]” columns. Note that the full path to the file on the /uod/idr/filesets location
needs to be given in the filePaths.tsv file. There aren’t the full
paths in the assay file and so these must be added, possibly using a text editor find and replace function.
The other way is to look at the files under the /uod/idr/filesets location on the command line
and whilst being in the folder of interest, such as experimentA, running
find .
This gives you a full list of files, with relative paths. Copy and paste it to your text editor, remove the folders and the files which are not meant to be imported and replace the relative paths
with the full paths to /uod/idr/filesets using your local text editor and find and replace function.
Never import from any other location than the /uod/idr/filesets !
NOTE
It can happen that the filePaths.tsv or plates.tsv are less rich than the assys/library files. This is because:
- the assays file MUST list every image created in the DB under the project as a separate row
- the library file MUST list every well created in the DB under the screen as a separate row
On the other hand, filePaths.tsv and/or plates.tsv files are input files containing paths sent to bin/omero import. These can be either directories or individual files.
For plates, one possibility is to start by listing all the plates directories on
/uod/idr/filesets and save these to a file which can then be edited to add
the plate names.
find . -maxdepth 1 -type d > ~/idr0030-topLevelDirectoryList.txt
(Saves to your home directory on idr0-slot3, and then you can scp the file to your laptop).
Example is
If .screen files are used to group the images into plates then these are listed instead
Load images into idr-pilot, then idr-next
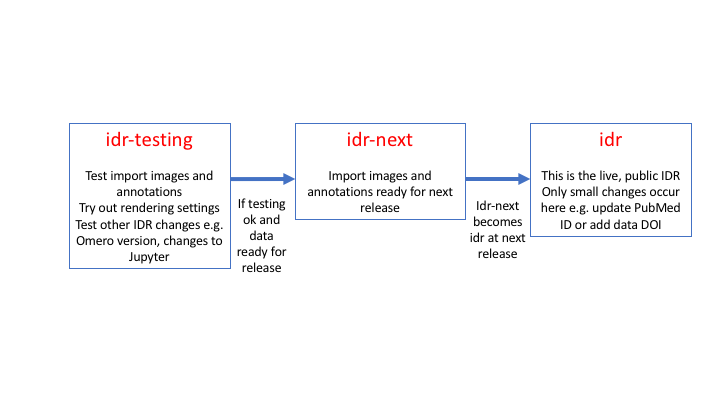
With a new dataset we first test import the images and annotations into idr-pilot. A new idr-pilot is created for each study. Then if that is ok, we do the same again in the staging server, idr-next. Idr-next is then switched to become the next production idr when the data is ready for release (often alongside the publication).
Figure 4 Summary of the idr-pilot/idr-next/idr workflow
Steps of the import process:
-
Set up connection to idr-pilot/idr-next
-
Get the files needed for import (
plates.tsvorfilePaths.tsvandbulk.yml) onto the server by cloning the GitHub repo -
Prepare environment inside the server terminal which allows in-place import to work
-
Do the import on the command line
Setting JVM options
For import of some studies, JVM options need to be configured as shown below. Please insert the command accordingly to the importing workflow below.
export JAVA_OPTS=-Xmx4G
Load the data into idr-pilot/idr-next
Prepare study repo and check data
A necessary prerequisite is to have a study repository ready. See Prepare a study repository for more information on how to create a GitHub repository.
Do not import from any other location on the server (i.e. for example no /nfs... paths should be in your xxxfilePaths.tsv file).
Study your filePaths.tsv file in order to understand whether or not you need to pre-create the Datasets (in case same named Datasets already exist). Also, you want to know if both the Projects and Datasets will be created at import, or just Datasets.
You can use a helpful Dataset creation script which pre-creates Datasets (but not Projects, these must be created manually upfront) from the filePaths.tsv file. As OMERO imports into the most recently created or “touched” Datasets, even if Datasets of the same names exist on the server, the sequence of running Dataset creation script followed soon by the import using the same filePaths.tsv makes sure the images are not imported into the Datasets of the same name created a long time ago. Mind the exception described in the note below though.
NOTE
In case there are Datasets of the same name in different Projects (Experiments) of the same study, it is necessary to pre-create and import the Projects one-by-one. This means, create the first Project (manually) and its Datasets using Dataset creation script, then immediately import the images belonging to the first Project’s Datasets. Then, create the second Project and its Datasets and immediately import images into the second Project/Dataset structure and so on. Pre-creating all P/Ds first and then importing all images into them will not work in such case.
Do the import on the command line
Shell into the server you intend to import (pilot-idr**). Note that the commands below assume config edits.
Clone the study repository. To make sure that cases where the study contains additional metadata files required for the import, typically patterns, screens or companion files, are taken care of, please always clone into the /uod/idr/metadata. This is a recomended “good practice” for all other cases as well:
cd /uod/idr/metadata/
sudo -Es git clone git@github.com:IDR/idr0092-ostrop-organoid.git
sudo -Es git pull origin master
Sudo as the omero-server user. This is necessary for in-place import and for in-place upload of File Attachments.
sudo -u omero-server -s
Still as omero-server user, start a
screen
session so that if your connection to the server is lost stdout output
from the import will not be lost. There are some useful hints about screen commands here below. The name of the screen should match the study name, as shown in example below:
screen -S idr0093
Activate the virtual environment to be able to call omero commands from anywhere and to have a handy python environment to run scripts in.
source /opt/omero/server/venv3/bin/activate
Define the OMERODIR (necessary for imports only).
export OMERODIR=/opt/omero/server/OMERO.server
Log in to OMERO. The username for importing data on all 3 servers is demo. Password is available in the OME credentials store (pass).
omero login demo@localhost
To import Experiments:
omero import --bulk idr0048-abdeladim-chroms/experimentA/idr0048-experimentA-bulk.yml --file /tmp/idr0048.log --errs /tmp/idr0048.err
The whole output will go into the idr0048.err file (even when no errors are detected). Depending on your filePaths.tsv file, the import command will create the datasets with files inside them or a new Project with Datasets and Images in them. You might need to log in
to the WebUI and move the datasets into the right project.
To import Screens:
omero import --bulk idr0093-mueller-perturbation/screenA/idr0093-screenA-bulk.yml --file /tmp/idr0093.log --errs /tmp/idr0093.err
This import command will create a new Screen (Screen in OMERO sense).
Screen session commands
You can leave the screen session on the command line by pressing Ctrl+A followed by Ctrl+D. The output of the command line will expose the name of the screen.
You can rejoin the screen by typing screen -r. Possibly, more screens are available as the omero-server user is shared with other importers. Then, a list of available screens will appear. Choose your screen and run screen -r 13717.idr0048, replacing the 13717.idr0048 accordingly with the screen name from the previous output. To delete a screen, run screen -X -S 2893.idr0048 quit, again, replacing the name of the screen in the command.
Failed imports
If for any reason import fails at some point you can restart it and it
won’t reimport what you have already imported. If you DO want to
re-import something that has already been imported then you need to edit
the bulk.yml file to temporarily
comment out the exclude: "clientpath" line.
Direct import not using bulk
You can import an image file or plate directly but make sure you use the
--transfer=ln_s flag as we want to always use in-place import to spare space.
You may want to use a screen for long-running imports. For large imports you may also
wish to skip thumbnails and min/max calculation with --skip=all.
sudo -u omero-server -s
screen -S idr0038
source /opt/omero/server/venv3/bin/activate
export OMERODIR=/opt/omero/server/OMERO.server
omero login demo@localhost
omero import -d 710 --transfer=ln_s --skip=all "/uod/idr/filesets/idr0038-held-kidneylightsheet/20170905-original/disk2/time series data/Time-PNA-rh-vital-test.czi"
If you forget to use the --transfer=ln_s flag then you can delete the
imported images. First identify them with omero fs sets. It will list
your imports inverse chronologically and you will be able to see which
one doesn’t have transfer=ln_s. The number in the second column in the
table gives the ID for the fileset. Once identified you can test delete
the file set with omero delete Fileset:$ID --report --dry-run. If all
looks ok, then remove the --dry-run and run the command again.
Get the list of files to import
If you want to see what files would be imported then use the -f flag with your import command
omero import -f -d 710 --transfer=ln_s "/uod/idr/filesets/idr0038-held-kidneylightsheet/20170905-original/disk2/time series data/Time-PNA-rh-vital-test.czi"
And you’ll get a list of the files that would be imported (useful for screens).
To view the images after import, clear the cache (see Clearing the cache for instructions)
Clearing the cache
The IDR makes extensive use of nginx caching for performance reasons. When looking at idr-next or idr via the main Web UI, you are primarily using the cache. This means that after each operation modifying one of the Web panels (import, annotation, deletion…), the cache needs to be cleared. You don’t need to clear the cache on idr-pilot.
To do this you need to look at the screen or project in the WebUI using the special port 9000. First of all in a terminal window type
ssh idr-next.openmicroscopy.org -L 9000:localhost:9000
Then open in private/incognito window in Firefox/Chrome and enter the URL
http://localhost:9000/webclient/userdata/?experimenter=-1
Then navigate to the screen or project you have annotated and open some of the wells or images.
Also browse from the front page http://localhost:9000/ by clicking on any study. Then try browsing from idr-next.openmicroscopy.org/ in your incognito browser window.
After you have cleared the cache, you go back to the “normal” viewing mode of the server you worked with (i.e. you exit the ssh-ing terminal where you accessed via port 9000 and are accessing the e.g. idr-next webclient of the server via some form of VPN or directly when in UoD). Once in that webclient, make sure you click on “Studies” above the left-hand side tree. This is necessary especially if you added a new Project or Screen or deleted one. Otherwise, you might falsely conclude that the clearing of the cache was not successful.
Note: A lot of issues trying to clear the cache were experienced, it seems to work better in Chrome than Firefox.
Add the annotations
Prior to annotating, check the completeness of the idr00XX-XXXXX-annotation.csv file using the check_annotations.py script. Pass the path to your idr00XX-XXXXX-annotation.csv file as shown below, and the script will check that all images have a corresponding entry in the annotation file.
/opt/omero/server/venv3/bin/python /uod/idr/metadata/idr-utils/scripts/annotate/check_annotations.py Project:[Project ID] /path/to/idr00XX-XXXXX-annotation.csv
If this produces error messages, more detail can be found using the --output errors.csv option to create a new csv file with an extra column that contains the errors for each row.
Add the bulk annotation file to the screen or project
/opt/omero/server/OMERO.server/bin/omero metadata populate --report --batch 1000 --file idr0002-screenA-annotation.csv Screen:102

/opt/omero/server/OMERO.server/bin/omero metadata populate --report --batch 1000 --file idr0023-experimentA-annotation.csv Project:52
Then convert some values to map annotations.
/opt/omero/server/OMERO.server/bin/omero metadata populate --context bulkmap --batch 100 --cfg idr0001-screenA-bulkmap-config.yml Screen:3
Check that all the images indeed have the map annotations as expected, again using the check_annotations.py script. This time, do not pass the path to the idr00XX-XXXXX-annotation.csv and the script will look for the presence of map annotations on the images in OMERO. Images with no map annotations will be printed on StdOut.
/opt/omero/server/venv3/bin/python /uod/idr/metadata/idr-utils/scripts/annotate/check_annotations.py Project:[Project ID]
See the Updating annotations chapter of this document for how to delete/update annotations if necessary.
After adding annotations, clear the cache (see Clearing the cache for instructions)
Updating annotations
Annotations can be updated by either deleting all the annotations on screen or project and adding them all again, or by just deleting and re-annotating particular mapr categories.
You can’t just add annotations to certain plates or experiments (e.g. if another plate was added later), in this case you would need to delete all the annotations and add them all back again.
Delete all map annotations
OMERO has problems deleting highly linked annotations. To work around this first delete just the annotation links for the main mapr categories:
source /opt/omero/server/venv3/bin/activate
omero login demo@localhost
omero metadata populate --context deletemap --report --wait 300 --batch 100 --localcfg '{"ns":["openmicroscopy.org/mapr/organism", "openmicroscopy.org/mapr/antibody", "openmicroscopy.org/mapr/gene", "openmicroscopy.org/mapr/cell_line", "openmicroscopy.org/mapr/phenotype", "openmicroscopy.org/mapr/sirna", "openmicroscopy.org/mapr/compound", "openmicroscopy.org/mapr/protein"], "typesToIgnore":["Annotation"]}' --cfg path/to/config-bulkmap.yml <Object>:<id>
This may leave behind orphaned annotations which may be cleaned up one day. To delete the remaining annotations:
omero metadata populate --context deletemap --report --wait 300 --batch 100 --cfg path/to/config-bulkmap.yml <Object>:<id>
Delete one (or a few) mapr categories
This is the same process as deleting all the map annotations but this time you specify which mapr categories you want to delete and annotate again. E.g. if you have got some new ontology mappings for phenotypes to add you would first regenerate your input files e.g. regenerate the annotation.csv with the new mappings which you will have added to the study file. Then you edit the bulkmap-config.yml file so that it has links to the new CMPO terms for the relevant phenotypes. Then you are ready to do the re-annotation.
First delete all the old annotations in just the mapr category you want to update. You have to delete even the ones you are going to add back in (e.g. existing phenotypes that already have ontology mappings).
source /opt/omero/server/venv3/bin/activate
omero login demo@localhost
omero metadata populate --context deletemap --report --wait 300 --batch 100 --localcfg '{"ns":["openmicroscopy.org/mapr/antibody"], "typesToIgnore":["Annotation"]}' --cfg path/to/config-bulkmap.yml <Object>:<id>
Delete the bulk annotations
If the bulk annotations need to be updated because the content of the annotation CSV file has changed you must first delete the existing bulk annotation file(s):
omero metadata deletebulkanns Project:<id>|Screen:<id>
Re-annotate
Add the new bulk annotation and re-annotate the project/dataset as described in Add-the-annotations.
After updating annotations, clear the cache (see Clearing the cache for instructions)
Apply any rendering settings
The channel names, colour and max and min intensities can be changed for single images or for whole screens using yaml configuration files.
Good practice is to just put in the file the parts that need changing.
Examples:
https://github.com/IDR/idr0034-kilpinen-hipsci/blob/HEAD/screenA/idr0034-screenA-renderdef.yml
Apply the settings as follows:
/opt/omero/server/OMERO.server/bin/omero render set Screen:1551 idr0028-screenA-renderdef.yml

/opt/omero/server/OMERO.server/bin/omero render set Image:3414127 idr0038-experimentC-PNAVital-renderdef.yml
This works for Screens, Plates, Projects and Datasets.
Don’t use the --copy flag unless want to copy the min and max settings
from the first well/image to all others.
Attach files in-place
Some studies will include files typically produced as the outcome of image processing or analysis (features, tables, tracks, segmentations) that need to be attached to images. Some live examples of these types of attachments can be found in https://idr.openmicroscopy.org/webclient/?show=image-4496763 (MAT/CSV files) or https://idr.openmicroscopy.org/webclient/?show=image-6001237 (TIFF labelled image).
Similarly to in-place image import, the IDR strategy is to in-place upload such files using symlinks and create FileAnnotation objects that can be linked to any objects in the database. The pypi.org/project/omero-upload/ Python library contains some useful code allowing to perform such in-place upload.
To learn more on how to use the library, please refer to study-specify scripts using > omero_upload:
-
https://github.com/IDR/idr0047-neuert-yeastmrna/blob/master/scripts/upload-attachments.py
-
https://github.com/IDR/idr0052-walther-condensinmap/blob/master/scripts/upload_and_create_rois.py
-
-
More generally https://github.com/ome/omero-upload/network/dependents should list all public repositories declaring omero-upload in the top-level requirements file.
Create Regions of Interest (ROIs)
Some studies will include Regions of Interests that we want to publish in the rich representation. Examples of images with ROIs in the live database include https://idr.openmicroscopy.org/webclient/img_detail/4496763/?dataset=4451 or https://idr.openmicroscopy.org/webclient/img_detail/9528943/?dataset=10101.
A small subset of Bio-Formats readers support ROIs stored in proprietary file formats. In this case, the associated files will be uploaded and the ROIs converted at import time (e.g. MIAS data).
When ROIs are stored in a proprietary file format not supported by Bio-Formats, adding the regions of interest usually involves populating the IDR. There are two approaches:
-
Either the ROIs first need to be converted into an open format that is then loaded into the resource. For this scenario, the current preferred file format is OME-XML. The https://github.com/glencoesoftware/ome-omero-roitool library contains some utilities to import ROIs stored as OME-XML
-
Or the ROIs need to be translated on-the-fly while loading it into the IDR. This will usually involve some study-specific script that parses the ROI in the original format and translates it into OMERO ROIs. An example creating ROIs with points from CSV files is at https://github.com/IDR/idr0075-cabirol-honeybee/blob/master/Processed_Data/create_rois.py. For handling segmentation stored as labelled masks, some common code is available in https://pypi.org/project/omero-rois/
- see https://github.com/IDR/idr0062-blin-nuclearsegmentation/blob/master/experimentA/upload_features_rois.py and https://github.com/IDR/idr0052-walther-condensinmap/blob/master/scripts/upload_and_create_rois.py for examples of consumption of this library to read a labelled TIFF files and create ROIs with masks.
Annotate the top-level container
The
study_parser
class contains most of the logic required to parse and validate the
content of study files as well as annotate and verify the IDR containers
(screen/project). The idr-utils should be available at /uod/idr/metadata/idr-utils/
on IDR servers.
Without any options, the content of the study file will be validated by the parser
$ source /opt/omero/server/venv3/bin/activate
$ cd /uod/idr/metadata
$ python idr-utils/pyidr/study_parser.py idr0042-nirschl-wsideeplearning/idr0042-study.txt
The –set option allows to annotate the screen(s)/project(s) associated with the study:
$ source /opt/omero/server/venv3/bin/activate
$ cd /uod/idr/metadata
$ python idr-utils/pyidr/study_parser.py idr0042-nirschl-wsideeplearning/idr0042-study.txt --set
The –check option allows to verify that screen(s)/project(s) have been annotated correctly
$ python idr-utils/pyidr/study_parser.py --check idr0042-nirschl-wsideeplearning/idr0042-study.txt
Add the study metadata repository to the public IDR/metadata as a submodule
First make the private GitHub study repository visible.
Add it to the https://github.com/IDR/idr-metadata as a submodule.
Assuming you already have a local up-to-date checkout of idr-metadata run:
$ git submodule add https://github.com/IDR/idr0042-nirschl-wsideeplearning
Commit and push your changes to your fork of idr-metadata, and open a PR.
When the PR is merged update the idr-next omeroreadwrite clone of idr-metadata:
$ cd /uod/idr/metadata

$ sudo git remote update -p

$ sudo git merge --ff-only origin/master

$ sudo git submodule sync

$ sudo git submodule update --init
Generate the study stats
There are two places that need to be updated every time a study is ready for publication in the next IDR release
-
The two first tabs of the IDR dataset map spreadsheet, studies and releases
-
Data files in the idr.openmicroscopy.org repository:
First, update the data files. Use the
stats.py
script to update studies.tsv.
Either copy the output of the script and paste it as a new line into studies.tsv, or redirect it into the current studies.tsv:
cd /uod/idr/metadata
/opt/omero/server/venv3/bin/omero login
/opt/omero/server/venv3/bin/python idr-utils/scripts/stats.py --release prodNN idrNNNN-new-study -vv >> studies.tsv
It is also possible to run the script without the idrNNNN-new-study being under the /uod/idr/metadata yet. For this, do:
cd /tmp
git clone git@github.com:IDR/idrNNNN-new-study
/opt/omero/server/venv3/bin/omero login
/opt/omero/server/venv3/bin/python /path/to/idr-utils/scripts/stats.py --release prodNN idrNNNN-new-study -vv >> your-file.tsv
WARNING: This script automatically runs fs usage to calculate the disk space used by the study, and can take a long time to run.
Ensure you leave plenty of time before any deadlines.
WARNING: Do not run two or more different stats.py executions in different terminals on the same server. This can easily bring the OMERO.server down. Instead, pass more studies as argument into one single stats.py execution.
NB: for very large datasets like idr0043, the command above will not
return.
Disk usage can be disabled by passing the --disable-fsusage flag, and the size/number of files should be calculated by hand instead.
Ask other members of the IDR team for advice.
Once you have calculated the stats for a study open a pull request to update https://github.com/IDR/idr.openmicroscopy.org/blob/master/_data/studies.tsv Although it is helpful to have a single PR with all stats for studies to be released this is not essential, it is more important that the stats are recorded even if PRs conflict since this is easy to fix.
Generate the release stats
Once all the new studies have been appended to studies.tsv for the particular release, generate the release stats. Use the release.py script for that. You can run the script also on your local machine, all you need is to get the updated studies.tsv file:
cd path/to/idr-utils
venv/bin/python scripts/releases.py  /opt/IDR/idr.openmicroscopy.org/_data/studies.tsv --release prodXX --release-date YYYY-MM-DD --db-size <size-in-GB-see-below>
The database size should be obtained by:
export PGPASSWORD=$(/opt/omero/server/OMERO.server/bin/omero config get omero.db.pass)
export PGHOST=$(/opt/omero/server/OMERO.server/bin/omero config get omero.db.host)
psql -U omero idr -c "select pg_database_size('idr')"
Append the new rows from studies.tsv and releases.tsv to the two first tabs of the IDR dataset map spreadsheet,
studies and releases.
Publicize the study
When the publication is released we usually advertise the dataset on twitter. Its good if you can provide a link to the paper and an example image for the tweet. There is a tweetdeck team for IDRnews, Josh can add your twitter account to it then you’ll be able to tweet for IDRnews (I haven’t done this).
Get a DOI
A DOI is requested once the dataset has been pretty much finalized and we know what the URL will be in production IDR (i.e. once it’s in idr-next or idr).
An Excel spreadsheet is filled out with details about the study including. The IDR Team members fill out as much as possible and then send to the authors for finishing/checking.
This spreadsheet is then sent to the Research Support Officer in the library and the University of Dundee.
She then generates a DOI which will be minted when the resource gets lives/
The Research Support Officer then makes the DOI live whenever we want it to be live.
Finally the data DOI is added to the study file and to the screen/project attributes by re-running the study annotation . Then clear the cache - see Clearing the cache.
If just one screen or project/experiment in the study- then get one DOI
If several screens or projects in the study then we have started getting a parent DOI for a study ‘landing page’ e.g. https://idr.openmicroscopy.org/webclient/?show=screen-1502 and then child DOIs for each of the screens or projects. The author can then just put the ‘landing page’ DOI into their paper instead of listing all the child DOIs in the paper.
Converting selected images to Zarr
Preparation
For conversion, you will need:
- a working Python environment
- a working Java environment
- a copy of the https://github.com/IDR/idr-zarr-tools repository
- access to the /uod/idr/ mount point including an updated copy of idr-metadata. At the moment, only idr0-slot3 (“orca-3” or “goby”) is supported.
A conda environment with the Java and Python requirements can be created with:
conda create -n zarr -c ome -c conda-forge bioformats2raw omero-py zarr
conda activate zarr
pip install omero-web  # for imageMarshal FIXME
pip install https://github.com/ome/omero-cli-zarr/archive/master.zip
Selection of an image
Visit the webclient URL for the image you would like to convert, e.g. https://idr.openmicroscopy.org/webclient/?show=image-9836839 . For in-process images, visit the appropriate idr-next.openmicroscopy.org page.
Use the /../.. “Show file paths on server” button to show the original files. Choose the first and select it for later steps.
bioformats2raw (single-series images)
Run the docker image bioformats2raw from within the idr-zarr-tools repository to perform the conversion:
docker-compose run --rm -u $ID bioformats2raw \
    9836839 \
    "/uod/idr/filesets/idr0077-valuchova-flowerlightsheet/20200429-ftp/2018-12-18 ASY H2B bud 05 3D 8 angles_Maximum intensity projection.czi" \
    /out/idr0077
The arguments after “bioformats2raw” are:
- image ID for naming the zarr file
- the path to the file from the webclient
- the name of an output directory (in the docker container!)
bioformats2raw (Multi-series images)
First, generate a CSV file with the IDs of the series IN ORDER. This can be done manually, or via HQL:
omero hql --style=plain -q "select i.id, i.series from Image i where i.fileset.id = (select i.fileset.id from Image i where i.id = 9836839) order by i.series asc" | cut -f2,3 -d, | tee series.csv
9836839,0
9836840,1
9836841,2
9836842,3
9836843,4
9836844,5
9836845,6
9836846,7
Now, pass this file rather than the image ID:
docker-compose run --rm -u $ID bioformats2raw \
    /src/series.csv \
    "/uod/idr/filesets/idr0077-valuchova-flowerlightsheet/20200429-ftp/2018-12-18 ASY H2B bud 05 3D 8 angles_Maximum intensity projection.czi" \
    /out/idr0077
Adding metadata
The output of bioformats2raw only contains the multiscale metadata. To add the OMERO rendering metadata, use:
curl -o- https://idr.openmicroscopy.org/webclient/imgData/9836839/ > 9836839.zarr/omero.json
Or for a set of directories:
for x in $(seq 9836831 9836838); do curl -o- https://idr.openmicroscopy.org/webclient/imgData/${x%%.zarr}/ > ${x%%.zarr}.zarr/omero.json; done
Once that has been done, you can combine the omero.json output with the .zattrs file using:
./merge.py 9836839.zarr
Current datasets keep the omero.json file, but this is not necessary.
Masks
Use the omero-cli-zarr plugin to download masks for an image. If the masks have overlaps, you will
need to provide a map from Zarr group name to labeled image. e.g.:
omero hql --style=plain "select distinct s.textValue, s.roi.id from Shape s where s.roi.image.id = 5514375" --limit=-1 | tee rois.csv
omero zarr masks Image:5514375 --label-map=rois.csv
Submit for review
Changes to the S3 storage should be submitted to the team for review.
The instructions above will produce a local copy of the files on idr0-slot3 under the minio objectstore (/uod/idr/objectstore/minio/idr/zarr/v0.1/).
Metadata files from the newly created directories should be added to git which can be reviewed by the team. For newly created files, this includes all .zgroup, .zarray, and .zattrs files starting under the $IMAGE_ID.zarr directory.
For the addition of just masks, the same files related to the labeled
image itself should be added. Additionally, the masks/.zattrs file
should have one new entry pointing to the newly created file:
diff --git a/.zattrs b/.zattrs
index 31177d6..7e27166 100644
--- a/.zattrs
+++ b/.zattrs
@@ -1,5 +1,6 @@
 {
     "masks": [
-        "old"
+        "old",
+        "new"
     ]
 }
Transfer
To transfer the file to EBI, use the transfer docker image:
time docker-compose run --rm transfer \
    cp --acl public-read --recursive \
    /uod/idr/objectstore/minio/idr/zarr/v0.1/9836839.zarr/ \
    s3://idr/zarr/v0.1/9836839.zarr
or for a set of directories:
time for x in $(seq 9836831 9836838); do docker-compose run --rm transfer cp --acl public-read --recursive \
    /uod/idr/objectstore/minio/idr/zarr/v0.1/$x.zarr/ s3://idr/zarr/v0.1/$x.zarr; done
Miscellaneous
Restarting IDR OMERO.server
If an IDR OMERO server needs restarting, this can be achieved with
$ ssh idr
$ sudo service omero-server status
$ sudo service omero-server restart
Notes about submissions
Notes that are made about submissions and other useful files sent by the authors are copied to both the EBI and Dundee file systems. They used to be kept in the same directory as the image data but since we are likely to make these directories available for download of the image files I have moved them to /nfs/bioimage/drop/PRIVATE/ and /uod/idr/filesets/PRIVATE . There is one directory for each study.
In the EBI /nfs/bioimage/drop/ I have in some cases moved files from the original submission directories into the PRIVATE/ directories as I don’t think they would be useful for IDR users to download, and it might be better if they don’t e.g. drafts of papers, initial metadata files. (e.g. see /nfs/bioimage/drop/PRIVATE/idr0027). I didn’t have time to do this for all the directories at Dundee so they differ slightly in location of content from the ones at EBI.
Only emails that are not in the idr-submissions mailing list are included in the PRIVATE directories. Some submissions were ongoing when we got the mailing list and I’ve only saved by hand the emails that were not cc’d to idr-submissions.
Excel gotchas and useful things
Here are some things to watch out for.
-
If your on a mac and save a file using Excel you will get “mac” line endings. I have a perl script I run on the files to fix this but I think you can also use dos2unix filename (brew install dos2unix first)
-
If you open a .txt file in Excel that has Gene Symbols or things like ‘3/5’ replicates Excel will convert them to dates e.g. SEPT1 becomes SEP-01. To prevent this you can say that the columns are all “text” format rather than “general format”
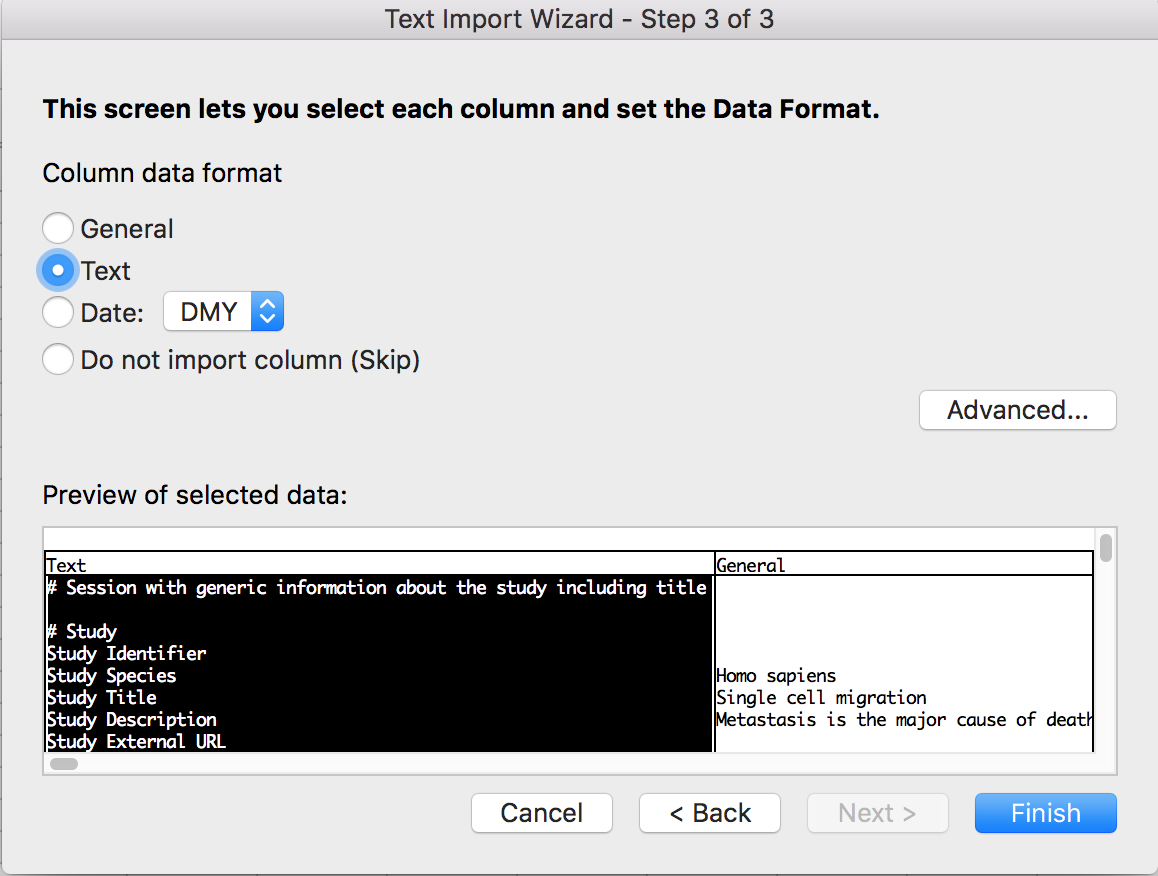
You CAN’T do this with .csv files so if you have to work on a csv file in Excel copy the file as .txt first (you can keep the comma separators) so that you can open it this way.
3. A really useful function in Excel is vlookup. You can merge the contents of two files with this e.g. add the siRNA identifiers and sequences from one file to you library file with the target genes. You just need a column in common (e.g. the gene symbols) between the two files.
idr0038 peculiarities
Idr0038 was slightly different to other datasets because of the way that the images were imported and displayed in omero.
To take just one set of images from experimentC which is the time series as an example - the ones in the PNA vital test data set http://idr.openmicroscopy.org/webclient/?show=dataset-712.
The assay file for this dataset lists all the files that were submitted to us (to show that all these files are required)
| Dataset Name | Image File |
|---|---|
| Time Series PNA vital test | Time-PNA-rh-vital-test.czi |
| Time Series PNA vital test | Time-PNA-rh-vital-test(1).czi |
| Time Series PNA vital test | Time-PNA-rh-vital-test(2).czi |
| Time Series PNA vital test | Time-PNA-rh-vital-test(3).czi |
| Time Series PNA vital test | Time-PNA-rh-vital-test(4).czi |
| Time Series PNA vital test | Time-PNA-rh-vital-test(5).czi |
| Time Series PNA vital test | Time-PNA-rh-vital-test(6).czi |
| Time Series PNA vital test | Time-PNA-rh-vital-test(7).czi |
| Time Series PNA vital test | Time-PNA-rh-vital-test(8).czi |
| Time Series PNA vital test | Time-PNA-rh-vital-test(9).czi |
| Time Series PNA vital test | Time-PNA-rh-vital-test(10).czi |
| Time Series PNA vital test | Time-PNA-rh-vital-test(11).czi |
| Time Series PNA vital test | Time-PNA-rh-vital-test(12).czi |
| Time Series PNA vital test | Time-PNA-rh-vital-test(13).czi |
| Time Series PNA vital test | Time-PNA-rh-vital-test(14).czi |
| Time Series PNA vital test | Time-PNA-rh-vital-test(15).czi |
| Time Series PNA vital test | Time-PNA-rh-vital-test(16).czi |
| Time Series PNA vital test | Time-PNA-rh-vital-test(17).czi |
| Time Series PNA vital test | Time-PNA-rh-vital-test(18).czi |
| Time Series PNA vital test | Time-PNA-rh-vital-test(19).czi |
| Time Series PNA vital test | Time-PNA-rh-vital-test(20).czi |
| Time Series PNA vital test | Time-PNA-rh-vital-test(21).czi |
| Time Series PNA vital test | Time-PNA-rh-vital-test(22).czi |
| Time Series PNA vital test | Time-PNA-rh-vital-test(23).czi |
| Time Series PNA vital test | Time-PNA-rh-vital-test(24).czi |
| Time Series PNA vital test | Time-PNA-rh-vital-test(25).czi |
| Time Series PNA vital test | Time-PNA-rh-vital-test(26).czi |
But in the filePaths.tsv file we only had to list the first file and all the others were correctly imported. If all were listed there was a message on import to say that all the others except the first were already imported
| Dataset:name:Time Series PNA vital test | /uod/idr/filesets/idr0038-held-kidneylightsheet/20170905-original/disk2/time series data/Time-PNA-rh-vital-test.czi |
But once the images are imported they are seen in IDR as 4 different files, one for each angle of the light sheet
Time-PNA-rh-vital-test.czi [0]
Time-PNA-rh-vital-test.czi [1]
Time-PNA-rh-vital-test.czi [2]
Time-PNA-rh-vital-test.czi [3]
And so the annotation.csv had to include a row for each of these 4 files not the 27 that were in the assays file and the time point factor had to be dropped.
| Dataset Name | Image Name |
|---|---|
| Time Series PNA vital test | Time-PNA-rh-vital-test.czi [0] |
| Time Series PNA vital test | Time-PNA-rh-vital-test.czi [1] |
| Time Series PNA vital test | Time-PNA-rh-vital-test.czi [2] |
| Time Series PNA vital test | Time-PNA-rh-vital-test.czi [3] |
Dataset Map
Sheets of the IDR Dataset Map that need updating for every new screen or project:
-
“Screens” - one row per screen or project. Columns up to Species/Type are vital.
-
The following columns up to Channel Names are semi-important.
-
The last column is oddly enough also important.
-
Please do not re-arrange columns or add new columns in the middle.
-
Sheets of the IDR Dataset Map that need updating for every new release:
-
“Releases”: Copy (don’t reference) the values for Sets through Files from the total on “Screens” after having adding screens & projects.
-
Update the Growth section
-
-
“By Type” / “By Species” only need updating if a new species etc. appears
-
“EuBI Links” needs information that will be used for publicity.
-
“Time of imports”: needs the SQL run from the top of the page. Various queries need to be updated as well as the graphs to take new values into account. This is the last sheet that needs regular updating.
